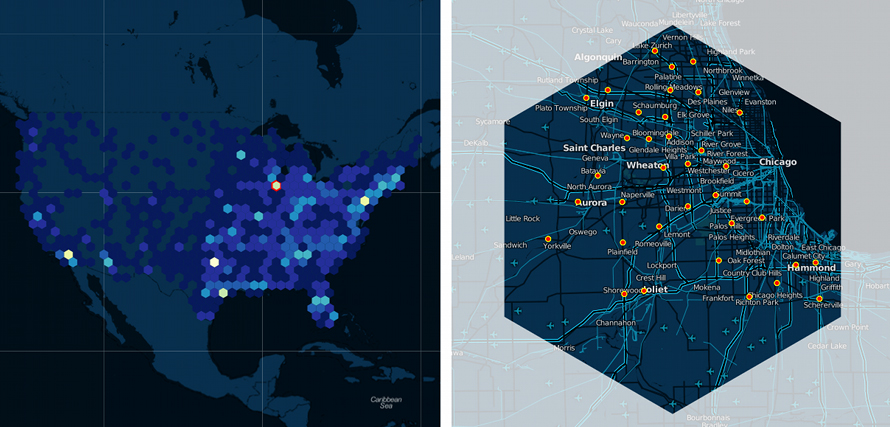
Hexbin map uses hexagons to split the area into several parts and attribute a color to it. The graphic area (which can be a geographical area) is divided into a multitude of hexagons and the number of data points in each is counted and represented using a color gradient. This chart is used to visualize density, where hexagon as a shape permits to create contiguous areas easily while dividing the whole space into discrete units.
Quick details
What: Discover Distribution, Rank
Why: Visualize the density of objects in the geographical space
History of Hexbin
In statistics, kernel density estimation (KDE) is a non-parametric way to estimate the probability density function of a random variable. Kernel density estimation is a fundamental data smoothing problem where inferences about the population are made, based on a finite data sample. In some fields such as signal processing and econometrics, it is also termed the Parzen–Rosenblatt window method, after Emanuel Parzen and Murray Rosenblatt, who are usually credited with independently creating it in its current form. The software implementations of KDE led to the generation of various Density 2D charts, among which hexbin got popular for representing spatial data covering geographies.
When to Use a Hexbin?
1When you need to create an unbiased density distribution
Use Hexbin or grid map over choropleth maps as in choropleths, a large polygon’s data looks more emphasized just because of its size, introducing a bias in perception. With a hexbin, each region can be represented equally dismissing the bias. If your regions have a broad range of sizes and it introduces a bias for the audience it works better to consider using hexbin maps instead.
2When you need to represent discrete categorical information
Hexbins are similar in nature to heatmaps except the fact that they can represent discrete information better using colors. One additional thing that can be done with this specific kind of map which can’t easily do with the heat map is to use categorical information. Here every single beam has been filled with a categorical color and because of that, it can visualize categorical information rather than quantitative information.

3Show complete information eliminating the edge effects
The idea with hexagons is to reduce sampling bias from edge effects of the grid shape, which is related to high perimeter: area ratios. A circle is the lowest ratio, but cannot form a continuous grid, and hexagons are the closest shape to a circle that can still form a grid. Hence, if working over a larger area, a square grid will suffer more from distortion due to curvature than shapes like hexagons. Hexagonal grids and hexbins are preferable when issues of connectivity, nearest neighborhood or movement paths are crucial aspects to be considered in the analysis.

Types of Hexbin
1. 2D Histogram Map
Histogram 2D chart displays a collection of two-dimensional histograms. Each histogram is drawn as a number of rectangular color spots reflecting the PDF(probability density function) value or envelope at the corresponding (X,Y).
2. 2D Density Plots
A kernel density estimate is used to get a 2d density plot. The number of observations within a particular area of the 2D space is counted and represented by a color gradient to indicate differences in the distribution of data in one region with respect to the other.
3. Contour Plot
A graphical technique for representing a 3-dimensional surface by plotting constant z slices, called contours, on a 2-dimensional format.
When Not to Use a Hexbin?
1When distinguishing regions in a geography is of importance
Map readers generally recognize a geographic area by it’s shape and orientation to other areas. For instance, the geography of a country is well known and people easily identify different regions. If the geography of a region needs to be visualized, hexbin maps do not work well, as these landmarks do not exist anymore and can confuse the audience. One solution for this is to choose a basemap that uses labels on top of the data layer.
2When a simplicity of definition and data storage is needed
Hexbins do not provide simplicity to store and retrieve data for changing. Alternately, the only explicitly geographical information required to define a raster grid are the coordinates of the origin (e.g. bottom left corner), the cell size, and grid dimensions (i.e. number of cells in each direction). The attribute data can be stored as an aspatial matrix, and the geographical location of any cell can be derived given that cell’s position relative to the origin. This makes data storage and retrieval easier for square grids since the coordinates of the vertices of each grid cell are not explicitly stored.
3Ease of resampling to different spatial scales(resolutions) is essential
Increasing the spatial resolution of a hexagonal grid is not easy as of a square grid which is just a matter of dividing each grid cell into four. Similarly, decreasing the spatial resolution is tedious in the case of hexbins. For square grids, it only requires combining groups of four cells into one, typically with some algebraic operation to aggregate the attribute data to the coarser resolution.